
| Results of a Traditional Inventory |
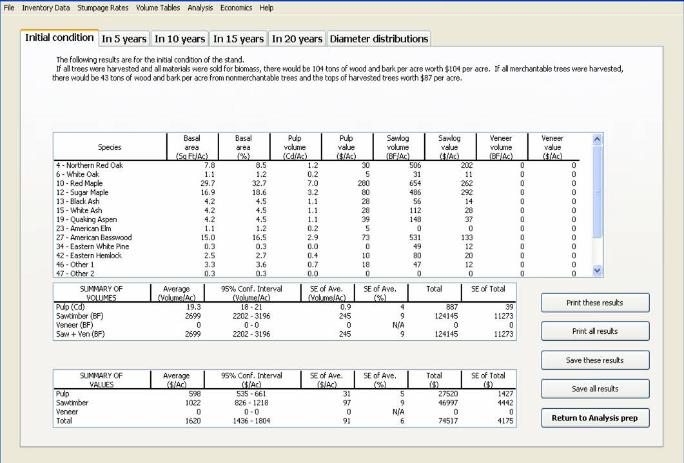
This page shows the results of a traditional inventory. By clicking on the tabs at the top of the page (when actually
using the program but not here) you can see the simulated results 5, 10, 15, and 20 years after the inventory was
done and calculate diameter distributions for any of the times.
To go to the next page of the tour, click here. To return to the home page, click here.
using the program but not here) you can see the simulated results 5, 10, 15, and 20 years after the inventory was
done and calculate diameter distributions for any of the times.
To go to the next page of the tour, click here. To return to the home page, click here.
| © 2019 Copyright CWM Software, LLC www.CWMSoftware.com Maintained with Site Builder January, 2019 |